

The Week in Charts: Issue #48
The Week in Charts: Issue #48
The charts and themes from the past week that tell an interesting story in crypto and investing…

1. All-Time-High
This week's developments in the Bitcoin market have been nothing short of exhilarating. We witnessed a new all-time high (ATH) of $70,055.50, even though the price is currently experiencing a minor pullback of 2.5%.
There was a moment of confusion on Tuesday regarding the validity of the ATH due to discrepancies between data providers. However, those doubts were dispelled by Friday's surge that definitively pushed BTC above the $70,000 mark for the first time, propelling the market capitalization beyond a staggering $1.3 trillion.
The narrative has now shifted to the question of sustainability. How much higher can Bitcoin climb? Do we have enough fuel left in the tank to propel a genuine supercycle?
The very definition of a supercycle is currently under debate. Does it represent a prolonged period of growth or a shorter, more explosive cycle? Meanwhile, the "death of the 4-year cycle" trope has resurfaced in the crypto Twittersphere, a familiar refrain that has echoed throughout Bitcoin's history.
Spot ETF inflows have emerged as another factor potentially differentiating this cycle from its predecessors. However, hindsight is always 20/20. In the present moment, data remains our guiding light. While these data points are well-established and reliable, past performance is never a guarantee of future results.
Looking ahead, I believe that many of the models and metrics we currently rely on may become less effective. This is a natural consequence of model decay, a concept familiar to all quantitative analysts. Furthermore, the introduction of spot ETFs is poised to alter market dynamics in the long term. Nevertheless, until new paradigms emerge, we must make the most of the tools at our disposal.
In the spirit of informed analysis, I will be presenting a series of charts to illuminate our current position within the Bitcoin cycle. By leveraging these visuals, we can gain a deeper understanding of the potential road ahead.

The chart we're examining (above) sheds light on Long-Term Holder (LTH) Net Position Change, a metric that's been trending negative for several weeks. This signifies that LTHs, defined as users who haven't spent their coins in over five months (155 days), are currently selling more than they're buying.
But why are LTHs so important? According to Glassnode, a widely respected blockchain analytics firm, coins held for more than 155 days tend to be less likely to be moved, suggesting a degree of price insensitivity. These LTHs are often referred to as "smart money" because they've historically demonstrated an ability to time the market, profiting by selling near peaks and buying during dips.
Therefore, to answer the crucial question of Bitcoin's potential for further rallies, we need to closely monitor LTH behaviour. It's important to remember that a single negative net position change doesn't necessarily signal a market top, nor does a positive change guarantee a bottom. What truly matters is the persistence of these inflows or outflows – sustained trends in either direction provide valuable insights.
The next chart we'll explore focuses on "drawdown in supply held by long-term holders from local peaks as a % do BTC supply." In simpler terms, this metric reveals the relative amount of Bitcoin that LTHs have sold compared to the current total market capitalization.
This builds upon the previous chart by providing not just the timing of LTH selling, but also the magnitude. Remember, not every instance of LTH selling should trigger panic.
Here's how to strategically interpret this data:
● LTH Distribution Threshold: A level of around 7% of the total BTC supply distributed by LTHs can be considered a potential warning sign. This suggests a more significant sell-off by long-term holders.
● Red Flag Zone: If LTH distribution surpasses 9% while the price continues to climb sharply, it becomes a more alarming signal. This could indicate a market blow-off top, a period of unsustainable price inflation before a potential correction.
However, it's crucial to avoid rash decisions. Even when approaching the 7% threshold, a measured approach is key. This could involve implementing a Dollar-Cost Averaging (DCA) sell strategy to gradually exit your position as the metrics inch closer to 9% and the price continues a rapid ascent.
The blow-off top can often be a prolonged period, and attempting to pinpoint the exact peak is highly challenging. Instead, approaching this zone with caution is a more prudent strategy.
Currently, with the LTH distribution hovering around 3%, we're far from either the "warning zone" or the "red flag" territory. This level typically aligns with periods of renewed LTH accumulation as prices rise.
The key takeaway? We should be looking for a combination of factors: persistent negative net position change from LTHs and a distribution exceeding 7% of the total BTC supply. Only then does it become prudent to consider gradually scaling out of your holdings.

While we've established the importance of Long-Term Holder (LTH) behavior overall, it's valuable to delve deeper and analyze their activity based on the age of their holdings.
The underlying principle is that the longer coins remain unspent (older than 155 days), the less their holders are swayed by short-term price fluctuations. Therefore, when these "older coins" start moving, it signifies a potentially significant shift in sentiment.
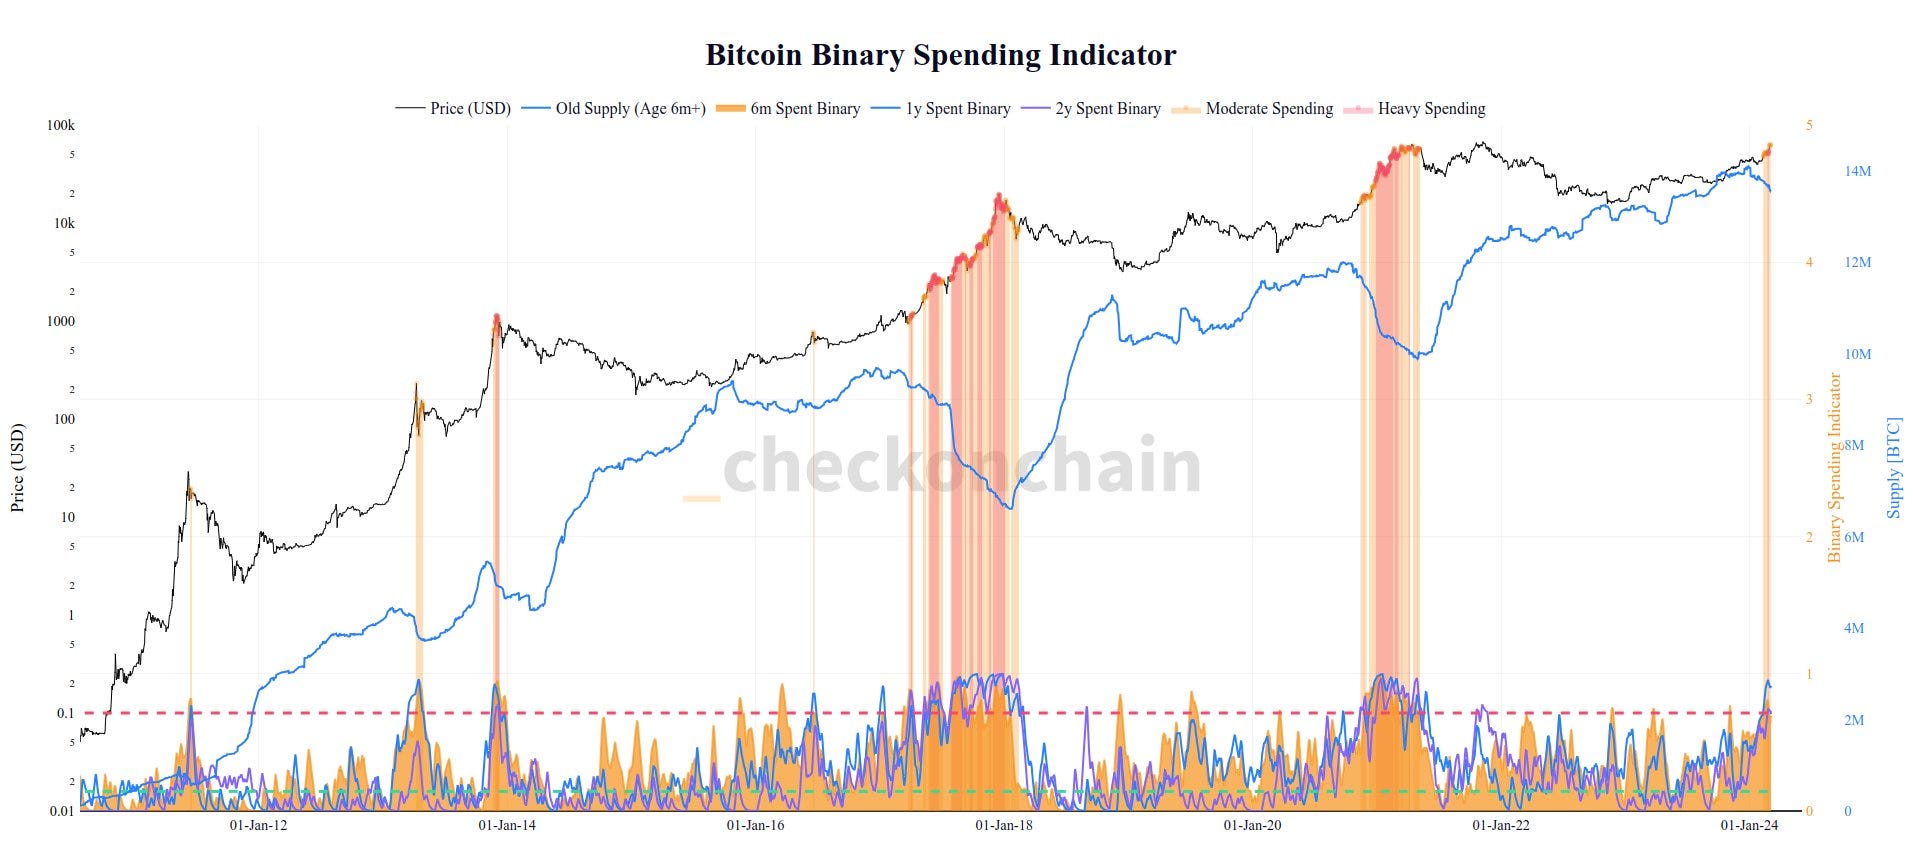
The chart we'll examine now focuses on LTHs categorized by the age of their coins: 6 months to 2 years.
Here's how to interpret the spending activity within these bands:
● Moderate Spending: This occurs when the spending metric for both 6-month and 1-year LTH cohorts surpasses a 0.1 threshold. This suggests a pick-up in selling activity, but not at an alarming rate.
● Heavy Spending: A scenario where all three LTH bands (6 months, 1 year, and 2 years) exhibit spending above the 0.1 threshold indicates a potentially more substantial sell-off by long-term holders.
Currently, we're observing the early stages of moderate spending, with the 6-month and 1-year LTH bands breaching the 0.1 level. While this suggests a slight uptick in selling by these cohorts, it's not yet a cause for major concern.
The question naturally arises: why are LTHs, with a historical acquisition price of $20,700 per Bitcoin, deciding to spend now?
Several factors could be at play:
● Profit-Taking: Having potentially tripled their investment, LTHs might be cashing in on some profits to lock in gains.
● Risk Management: A prudent LTH might be taking advantage of the current bull run to diversify their holdings or reallocate capital.
● Shifting Market Conditions: LTHs, despite being less sensitive to short-term price movements, could be reacting to broader market sentiment or potential changes in their investment thesis.
It's important to remember that the reasons behind LTH selling behaviour can be multifaceted. By closely monitoring the various LTH spending metrics we've discussed, we can gain valuable insights into potential market shifts and make informed investment decisions.

To assess the incentive for LTHs to sell, we can utilize the LTH Market Value to Realized Value (MVRV) ratio. In simpler terms, this metric reflects how much profit LTHs are sitting on.
Currently, the LTH MVRV ratio sits at 3.28, indicating that LTHs are up an average of 288%. Historically, a level above 3.5% has been considered a potential "blow-off threshold," a point where LTH selling could intensify.
Interestingly, the LTH MVRV peaked at 13 in the 2017 cycle and 10 in the 2021 cycle. This suggests a possible trend of diminishing returns, with the peak MVRV for LTHs potentially falling below 10 in this cycle. However, the exact peak remains uncertain.
By monitoring the LTH MVRV in conjunction with the LTH spending metrics we've previously discussed, we can develop a more comprehensive understanding of LTH behaviour and its potential impact on the market.

While predicting the exact duration or peak of this bull cycle remains elusive, one thing is clear: we've likely surpassed the initial phase. As we navigate uncharted territory above all-time highs, a new chapter unfolds.
Historically, these latter stages of a cycle tend to be the most volatile and unpredictable. Therefore, approaching the market with a healthy dose of caution is crucial.
This doesn't preclude the potential for further gains, but it underscores the importance of sound risk management strategies.
2. New Read

I have published 5 research pieces/articles on NODO since the last issue.
● Ethena USDe: Understanding Potential and Risks.
● Omnichain Domains: Simplifying Cross-Chain Interactions.
● Bitcoin-as-a-Platform (Part 1): Namecoin.
● Bitcoin-as-a-Platform (Part 2): Colored Coins.
● The Nakamoto Upgrade: A Paradigm Shift for the Stacks Blockchain.
And that's it for this week.
Have a great weekend everyone.
- Passie
Forwarded this email? Sign up here to subscribe.